Local Observability Stack
In this tutorial, you will run the local query-only flow with Docker:
OpenTelemetry Demo -> duckdb-otlp OTLP writer -> Quack DuckLake catalog -> canardstack query APIs -> GrafanaYou will send OpenTelemetry Demo telemetry to duckdb-otlp, query it through
canardstack, and open a provisioned Grafana dashboard.
For duckdb-otlp writer configuration outside this Compose stack, use the
duckdb-otlp documentation.
Prerequisites
Section titled “Prerequisites”- Docker Compose
- A local OpenTelemetry Demo checkout
Start the Stack
Section titled “Start the Stack”From the canardstack repository root:
docker compose upThis starts:
- DuckDB serving a DuckLake catalog over Quack
- the published
duckdb-otlpimage running OTLP/HTTP ingest onlocalhost:4318 - canardstack on
localhost:9090 - Grafana on
localhost:3000
Grafana and canardstack are ready when the containers finish starting.
To test local canardstack image changes, add the build override:
docker compose -f compose.yaml -f compose.build.yaml up --buildConnect the OpenTelemetry Demo
Section titled “Connect the OpenTelemetry Demo”In your OpenTelemetry Demo checkout, add canardstack as an OTLP/HTTP backend in
src/otel-collector/otelcol-config-extras.yml:
exporters:  otlp_http/canardstack:    endpoint: http://host.docker.internal:4318    headers:      Authorization: Bearer dev-otlp-token-123456
service:  pipelines:    traces:      exporters: [debug, span_metrics, otlp_http/canardstack]    metrics:      exporters: [debug, otlp_http/canardstack]    logs:      exporters: [debug, otlp_http/canardstack]
Start the full demo with its extras layer:
docker compose \ -f compose.yaml \ -f compose.full.yaml \ -f compose.extras.yaml \ up --force-recreate --remove-orphans --detachOpen the demo store and let the load generator run:
http://localhost:8080/The demo collector exports OTLP/HTTP to duckdb-otlp on localhost:4318.
Flush buffered telemetry before opening Grafana:
docker compose exec ingest sh -c \ "printf '%s\n' \"SELECT * FROM otlp_flush('otlp:0.0.0.0:4318');\" > /tmp/duckdb-otlp-ingest.sql"Open the Dashboard
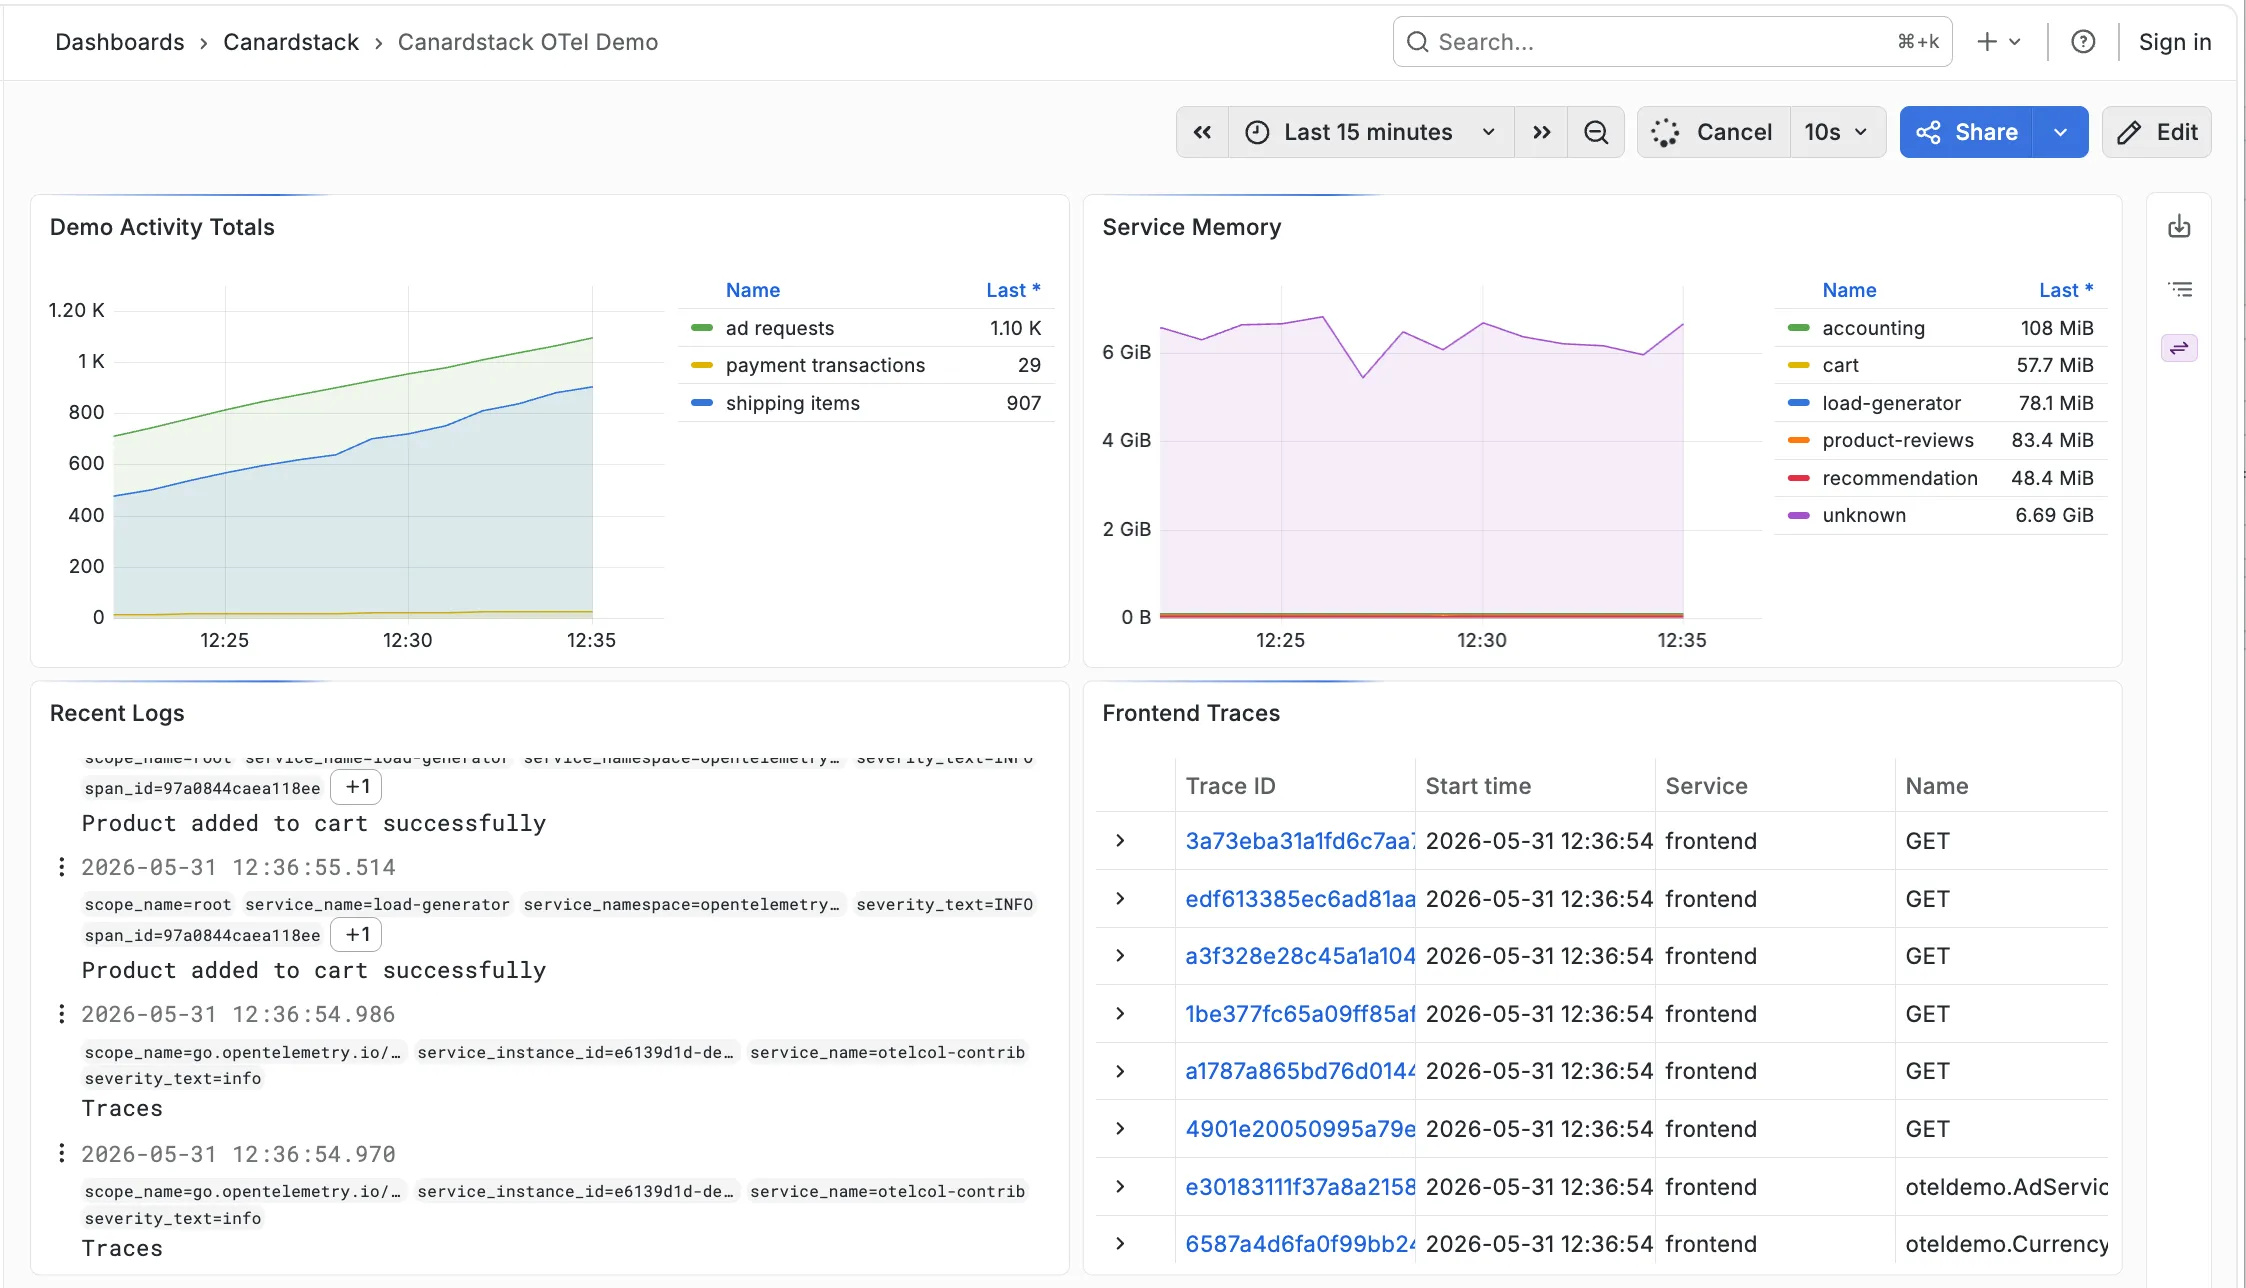
Section titled “Open the Dashboard”Grafana is provisioned with Prometheus, Loki, and Tempo datasources pointing at
canardstack, plus a Canardstack OTel Demo dashboard:
http://localhost:3000/d/canardstack-otel-demo/canardstack-otel-demoThe dashboard includes OTel demo activity metrics, service memory, recent logs, and frontend trace search results.
Query Directly
Section titled “Query Directly”You can also call the Loki API directly:
curl -sS -G http://localhost:9090/loki/api/v1/query_range \ -H 'Authorization: Bearer dev-canardstack-key' \ --data-urlencode 'query={}' \ --data-urlencode "start=$(python3 -c 'import time; print(int(time.time()) - 900)')" \ --data-urlencode "end=$(python3 -c 'import time; print(int(time.time()))')" \ --data-urlencode 'limit=10'You should receive a Loki success response once demo logs have been flushed into DuckLake.
- Serve an existing DuckLake catalog shows the smallest server command.
- Connect Grafana shows the datasource settings.
- Storage schema reference lists the table contract.
- duckdb-otlp documentation covers writer setup and OTLP ingest details.